About
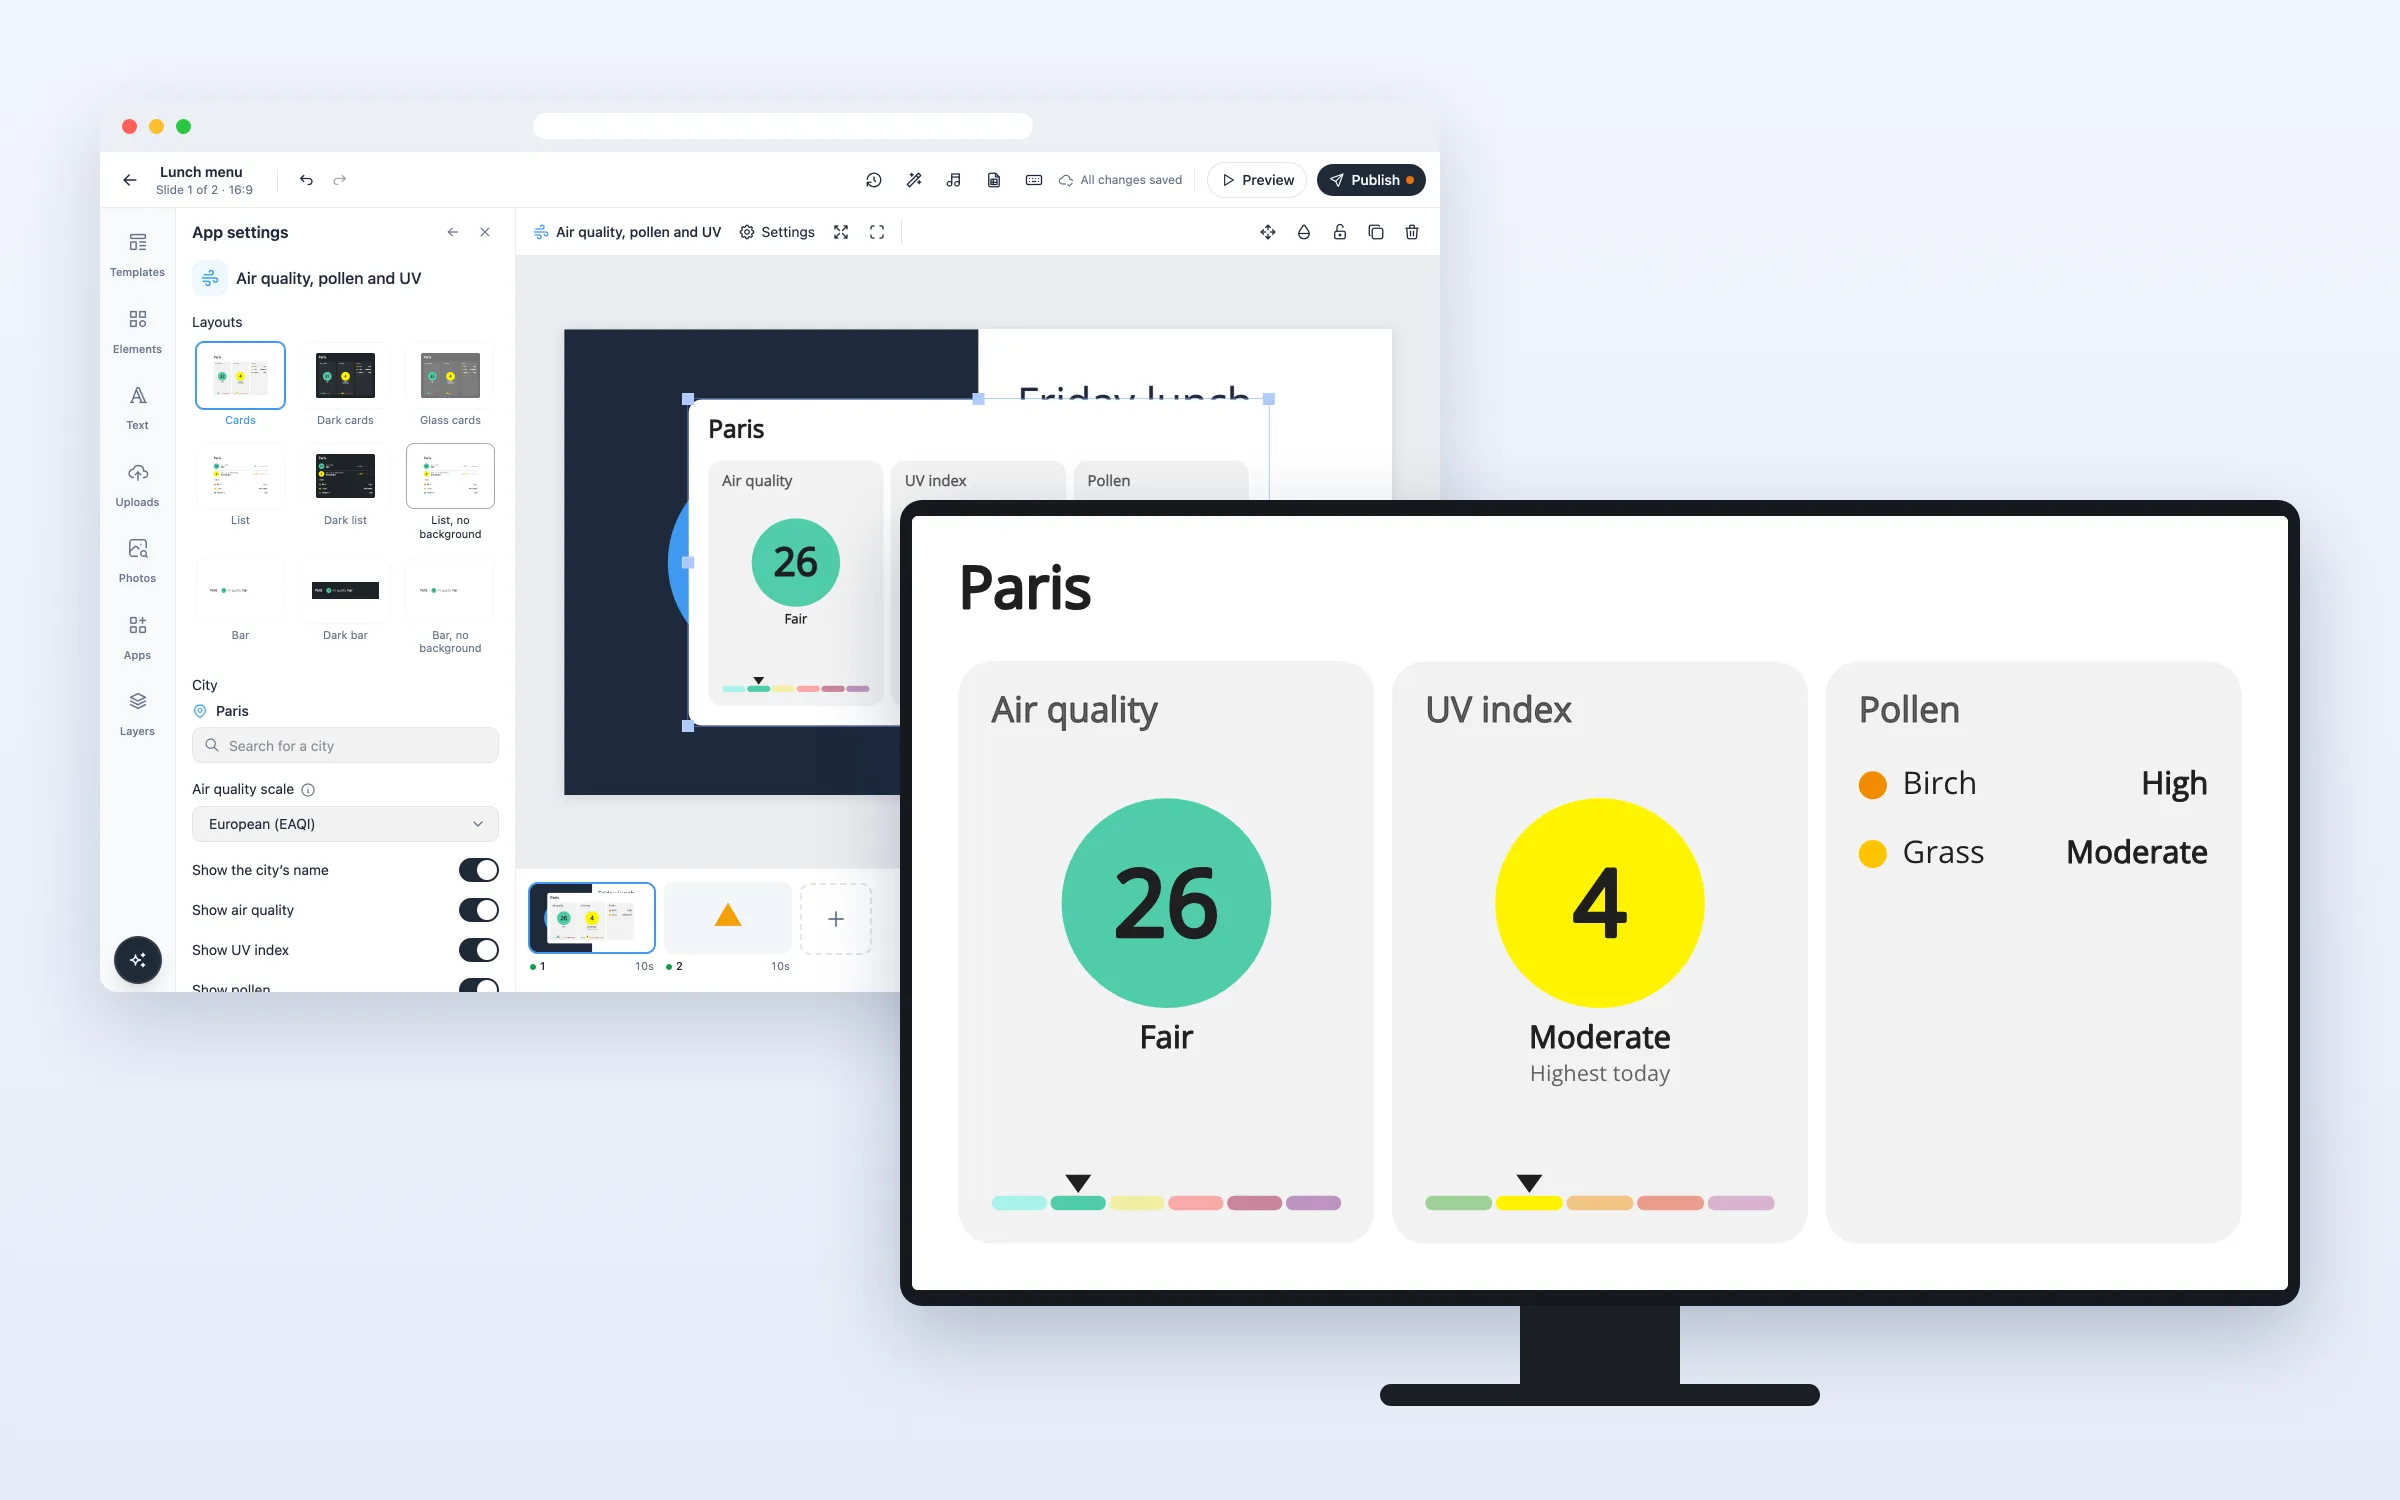
Show how the air is today in any city: the air quality index, the highest UV index of the day and, in Europe, the pollen in the air. Each value has a colour scale and a plain label such as “Good” or “High”, so people see at a glance whether to take their sunscreen or their allergy pills. The values come from Open-Meteo and update by themselves every hour, with nothing to set up. On every plan.
Get Started
Everything here starts in the editor: open your playlist and the slide. The editor saves by itself (“All changes saved”). When you’re done, click Publish.
Set it up
Add air quality to a slide
- Click Apps, and click Air quality, pollen and UV under Weather (or type “air” in Search apps)
- It’s added in the middle of the slide, for Paris (New York if your team uses US units), and App settings opens
- Pick one of the nine Layouts
- Under City, type the name of your city in Search for a city and pick it from the list
Choose what to show
- Turn Show air quality, Show UV index and Show pollen on or off
- Under pollen, turn off the types you don’t want (Alder, Birch, Grass, Mugwort, Olive, Ragweed)
- Leave Hide pollen types not in the air on to show only the types in the air today. When there are none, the screen says so
Use the US air quality index
- Set Air quality scale to US (AQI)
European (EAQI) is the EU’s index, from 0 to 100 and over. US (AQI) is the American index, from 0 to 500. Teams with US units start with the US index.
Options
Click the element on the slide to change these in App settings.
| Option | What it does |
|---|---|
| Layouts | Cards, Dark cards, Glass cards, List, Dark list, List, no background, Bar, Dark bar and Bar, no background. The bars are a low band for the top or bottom of a slide |
| City | Any city in the world. Pollen only for cities in Europe |
| Air quality scale | European (EAQI) or US (AQI) |
| Show the city’s name, Show air quality, Show UV index, Show pollen | On to start with |
| Pollen types | Alder, Birch, Grass, Mugwort, Olive and Ragweed, all on to start with |
| Hide pollen types not in the air | On to start with |
| Show pollen as | Levels (None to Very high) or Grains per m³ |
| Show the colour scale | A bar in the scale’s colours under each value, with a mark at today’s level. On to start with |
| Font | Open Sans to start with, or one of your team’s fonts |
| Colours | Text colour, Card colour and Card opacity |
| Rounded corners | How round the corners of the background are |
| Language | The words on the screen (labels such as “Good” and “High”): Same as the screen to start with, or one of 12 languages |
FAQ
Which plans include Air Quality, Pollen and UV?
Every plan.
Where do the values come from?
From Open-Meteo, which passes on the forecasts of the EU’s Copernicus Atmosphere Monitoring Service (CAMS). They are forecasts for the area around the city, not readings from a sensor on a street. Screens get new values every hour.
Why is there no pollen for my city?
The pollen forecast only covers Europe. For a city outside Europe, such as in the US, the screen shows the air quality and the UV index, and the settings say why pollen isn’t shown. In winter, when nothing is in the air, the screen says “No pollen in the air today”.
Which UV index does it show?
The highest UV index of the day (“Highest today”), the one to plan your sunscreen by.
What if the screen goes offline?
It keeps showing the last values for up to 24 hours, then leaves the area empty rather than show old air.
Do my screens need an update?
No. Screens show it like other web apps, on the players you already have.